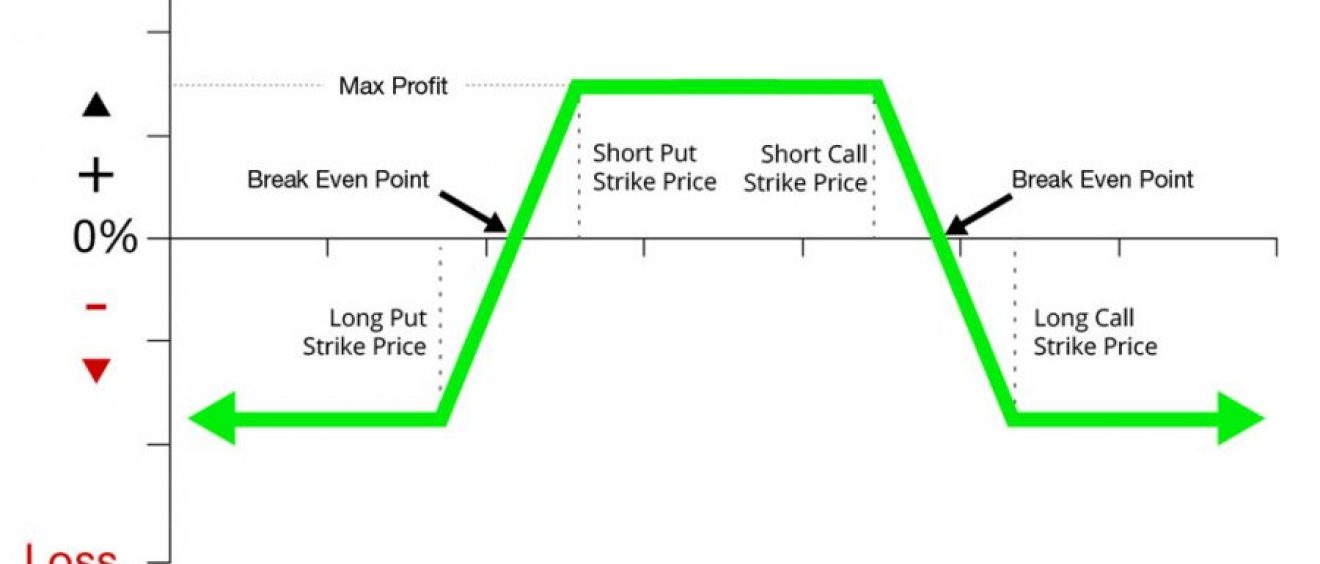
Jim Olson Iron Butterfly 0DTE Trade Plan

Iron Butterfly involves selling the ATM call and put and buying wings.

Sell the Open in the first 1 minute. The official open price for SPX is almost never accurate because all 500 stocks don’t immediately have bid at open. I wait 10 – 15 seconds after open to see where SPX is trading. This is the price I use to determine the strike I’m going to sell. I never try to guess direction with the Iron Fly. If SPX is trading at 3102.50, I would do $3100 or $3105. I would never do further out and try to guess the direction of the market. I don’t care what indicators you use. Price action is all that matters and will always win. By selling the open the most premium decay will happen in the first 30 minutes regardless of the IV environment.

SPX options start trading at 3 AM Eastern. They stop from 9:15 to 9:30. At 9 AM I start looking at the options to see where we are trading at. I look at what the Implied Move for the day is. I look at see what type of credit I can get. If the Implied Move is under $30, I will simply use $50 wings. If the Implied Move is over $30 you will need to increase the wing size so you can get out of the trade faster. The more money you pay for the wings the longer you will stay in the trade. Never look at the options from 9:15 to 9:30 because the option prices will be messed up.

Example on June 15th 2020

The ATM $2980 Call and Put was ~ $45.50 at the open.

$50 Wings $2930/2980/3030 the credit is $33.80. So the Wings cost you $11.70

$60 Wings $2920/2980/3040 the credit is $37.15. So the Wings cost you $8.35

$70 Wings $2910/2980/3050 the credit is $39.70. So the Wings cost you $5.80

$80 Wings $2900/2980/3060 the credit is $41.25. So the Wings cost you $4.25

$90 Wings $2890/2980/3070 the credit is $42.55. So the Wings cost you $2.95

$100 Wings $2880/2980/3080 the credit is $43.50. So the Wings cost you $2.00

My general guideline is to keep increasing the wing size by $10 until you stop receiving at least a $1.00 extra credit. So in the example above I would you $80 wings. In my opinion it isn’t worth it to go $10 wider from $90 wings to $100 wings to collect $.95.

I am currently using TOS to trade so I’ll walk through a trade. I open the Trade tab and type in SPX. I pull up the 0-DTE option chain. I changed the Spread to Single. Now you can simply hold down the ctrl key and select the strikes you would like. You select the bid side to sell the strike and select the ask side to buy the strike. If you like to use the App turn the Spread to Custom to easily select the strikes you want.

Example from June 21, 2020

At 9:30:30 SPX was trading at $3150.47. So lets sell the $3150 call and put and buy the $3200 call and $3100 put. The mid price is showing a $20.85. I would leave it at the mid price and confirm and send the order. If you don’t get filled in the first minute lower the price by $.10 and send the order again. I usually wait 1 minute before changing the order again. Lets assume we got filled at the $20.85. I always use a limit order to get in and I never lag in. Please note the Break Even Stock Prices (3129.75 / 3170.85) are the prices I use for my stop loss.

Profit Target is $1.50. So $20.85 – $1.50 = $19.35. So I would set my buy order for $19.35.

My stop loss criteria simply the break even stock price. After I get filled I will draw a price line on my chart with $3129.15 and $3170.85. With TOS you can also set a conditional order based on SPX price.

So lets walk through placing a OCO trade. One order will be a buy order to take profit, the other order will be a order to take you out if SPX crosses $3129.15 or $3170.85.

First make a limit order to buy back at $19.35 Then select advanced order and change to OCO.

Click on the first order and select create duplicate order. Change this order to market. Then select the gear icon.

This will open a new screen where you can enter conditions. Put the Symbol to SPX, Method Mark, Trigger >= $3170.85

You can enter another one for SPX with the opposite for $3129.15 Enter Save and then you are ready to confirm and send the order.

Double check on the Order Confirmation page with the conditions to make sure they are right.

How to determine if you can hold of more of a profit. First, I would recommend taking ½ off at the $1.50 target. Look at the current chart with a 30 min candle setting. Compare what the range of the first 30 minutes is. If the range is $10 and you received a $20.85 credit this will increase the rate the ATM options are decaying. If I hold for more profit, I still like to be out by 11 AM Eastern. There is a lack of decay with this strategy from 12pm to 3pm Eastern.

If I get stopped out, I usually enter another Iron Fly near the area I was stopped out. I still keep my $1.50 profit target. The second Iron Fly is simply to help reduce my loss for the day.

Don’t get Greedy!! Remember Base Hits win baseball games. The same is true for portfolio over the long run.

Tips

#1 Don’t watch the P/L while in the trade. It is very jumpy the first 15 minutes.

#2 Don’t use TOS to paper trade it. It will give you bullshit fills that you would never get in real life. Instead I recommend just watching the mid price of the trade. To get out you need to see the mid price go past $.15 to $.20 your exit price. This way it is more realistic unlike TOS paper.

#3 Ondemand feature is horrible for this strategy.

#4 Always have the profit order out and sitting. Market changes are very fast.

#5 The wider the wings the better. See my comments above on how I usually increase my wings with the increase in Implied Move.

#6 If you are getting tested near your stop point I will often change my exit to a smaller profit target or even the credit received.

#7 Never ever lag out of this trade. I promise you that you will probably just make it worse.

#8 After 1 hour in the trade if you are underwater, I would consider changing my exit order. If you didn’t hit profit in the first hour your odds are no longer in your favor.


Credit: Jim Olson (Not me).

Sierra Chart

Sierra Chart is a professional Trading platform for the financial markets. Supporting Manual, Automated and Simulated Trading.

Sierra Chart – High-Performance Trading Platform

  • Complete Real-time and Historical, Charting and Technical Analysis platform for the financial markets.
  • Fully supports the open specification Data and Trading Communications Protocol for the community.
  • Now offers a high quality direct CME / EUREX / ICE / Euronext / LIFFE / NYSE / NASDAQ / Cash Indices market data feed.
  • Uses the very best engineering and design practices to produce well-organized, fast and ultra rocksolid software and services. We continue to strive to be as best as we can be.

Main Features of Sierra Chart

  • Sierra Chart is widely known for its stable, open, and highly customizable design.
  • Sierra Chart is solid professional quality software. Designed for efficiency and ease-of-use. It has an uncomplicated interface that can handle the most demanding applications. It is developed by an experienced and competent development team that stays on top of development. It has been proven and trusted by investors/traders/clearing firms for more than a decade.
  • Sierra Chart is extremely fast with a definite focus on high performance in all areas of the program.
  • Sierra Chart supports all types of markets: stocks, futures, indexes, currencies/forex and options.
  • Complete trading support, both basic and advanced. Including easy to use automated trading. Use our exclusive ChartDOM (depth of market) which is a functional Trading DOM fully integrated with charts.
  • Sierra Chart has excellent comprehensive documentation. Best quality support.
  • Sierra Chart supports numerous internal and external Data and Trading services. All the major data services and backend trading platforms are supported. Sierra Chart supports DTC making it automatically compatible with any external Data or Trading service using this protocol.
  • Sierra_Chart uses the FIX and DTC protocols for trading where possible, for the most reliable and trouble-free trading.
  • Sierra Chart is simple to get started with and simple to use. Download it and see for yourself. It is well organized with all functionality easily found. Yet it has the features and flexibility for advanced users.
  • You can create your own custom studies, indicators and trading systems using the Sierra Chart Advanced Custom Study Interface and Language or the built-in Excel compatible Spreadsheets. Or use ones developed by Sierra Chart users and third party developers.

Data and Trading Connectivity

  • Sierra Chart directly provides real-time forex, stock and futures data without having to use an external service.
  • Sierra Chart directly provides Historical Daily and detailed Intraday data for stocks, forex, futures and indexes without having to use an external service.
  • Sierra Chart supports many external Data and Trading services providing complete real-time and historical data and trading access to global futures, stocks, indexes, forex and options markets. All of the major Data services and Trading backends are supported.
  • Sierra Chart uses direct connections to all Data and Trading services. It does not use any in process blackbox API components. Sierra Chart does not use Java or .NET. It is fast 100% native C++ code. All of this means you have super high reliability, the best connectivity and support for connections.
  • For supported Trading services that provide OCO (order cancels order) and/or bracket order functionality on the server side, Sierra Chart uses this server side functionality for the greatest safety for OCO and bracket orders.

https://sierrachart.com/RegisterStep1.php?UserAffiliateID=b726ff2b7222b005921aaf1d2f570513

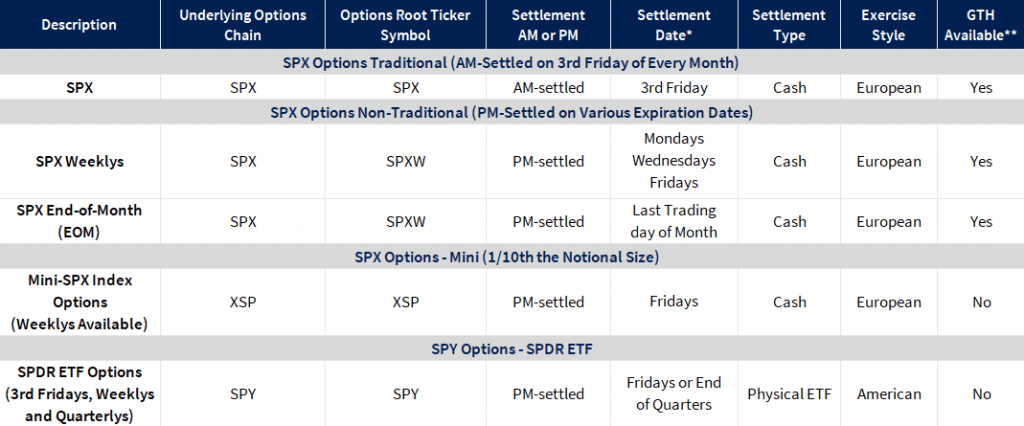
S&P 500 Index Options – SPX

Cboe’s SPX® options products provide investors with the tools to gain efficient exposure to the U.S. equity market and execute risk management, hedging, asset allocation, and income generation strategies.

Symbol:
SPX

Underlying:
The Standard & Poor’s 500 Index is a capitalization-weighted index of 500 stocks from a broad range of industries. The component stocks are weighted according to the total market value of their outstanding shares. The impact of a component’s price change is proportional to the issue’s total market value, which is the share price times the number of shares outstanding. These are summed for all 500 stocks and divided by a predetermined base value. The base value for the S&P 500 Index is adjusted to reflect changes in capitalization resulting from mergers, acquisitions, stock rights, substitutions, etc.

Multiplier:
$100.

Premium Quote:
Stated in decimals. One point equals $100. Minimum tick for options trading below 3.00 is 0.05 ($5.00) and for all other series, 0.10 ($10.00).

Strike Prices:
In-,at- and out-of-the-money strike prices are initially listed. New series are generally added when the underlying trades through the highest or lowest strike price available.

Strike Price Intervals:
Five points. 25-point intervals for far months.

Expiration Months:
Up to twelve (12) near-term months. In addition, the Exchange may list up to ten (10) SPX LEAPS® expiration months that expire from 12 to 60 months from the date of issuance.

Expiration Date:
The third Friday of the expiration month.

Exercise Style:
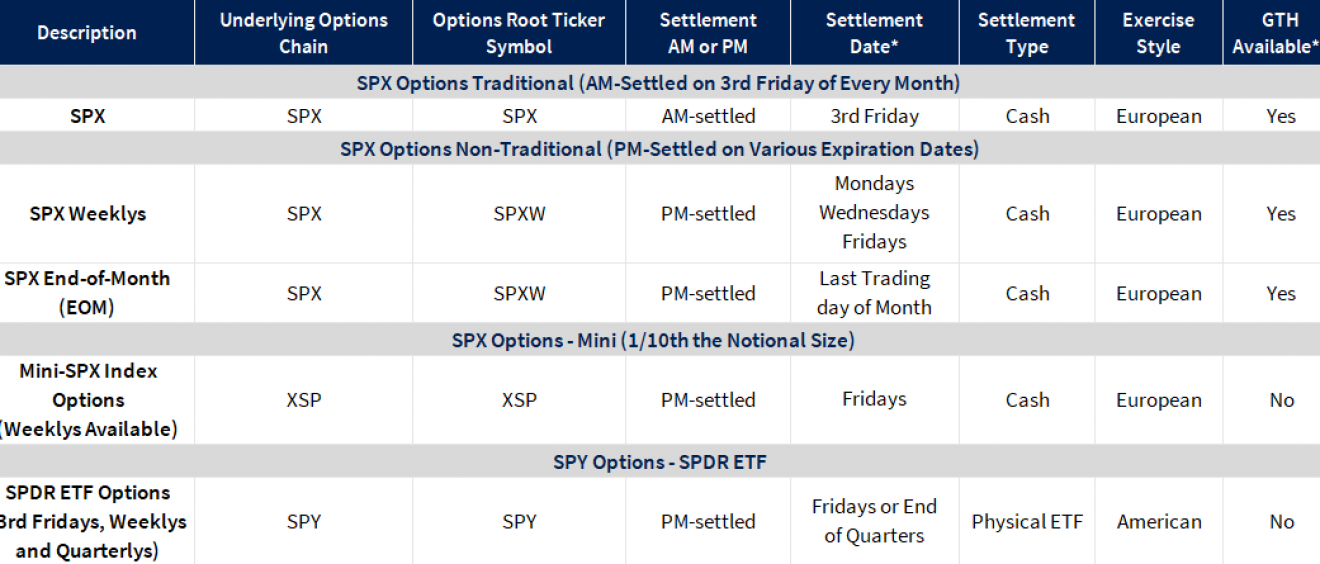
European – SPX options generally may be exercised only on the expiration date.

Last Trading Day:
Trading in SPX options will ordinarily cease on the business day (usually a Thursday) preceding the day on which the exercise-settlement value is calculated.

Settlement Value:
Exercise will result in delivery of cash on the business day following expiration. The exercise-settlement value, SET, is calculated using the opening sales price in the primary market of each component security on the expiration date. The exercise-settlement amount is equal to the difference between the exercise-settlement value and the exercise price of the option, multiplied by $100.

Position and Exercise Limits:
No position and exercise limits are in effect.

Margin:
Purchases of puts or calls with 9 months or less until expiration must be paid for in full. Writers of uncovered puts or calls must deposit / maintain 100% of the option proceeds* plus 15% of the aggregate contract value (current index level x $100) minus the amount by which the option is out-of-the-money, if any, subject to a minimum for calls of option proceeds* plus 10% of the aggregate contract value and a minimum for puts of option proceeds* plus 10% of the aggregate exercise price amount. (*For calculating maintenance margin, use option current market value instead of option proceeds.) Additional margin may be required pursuant to Exchange Rule 12.10.

Cusip Number:
648815

Trading Hours:
Extended Hours: 2:00 a.m. to 8:15 a.m. Central time (Chicago time).
Regular Hours: 8:30 a.m. to 3:15 p.m. Central time (Chicago time).

Mini-SPX Index Options (XSP)

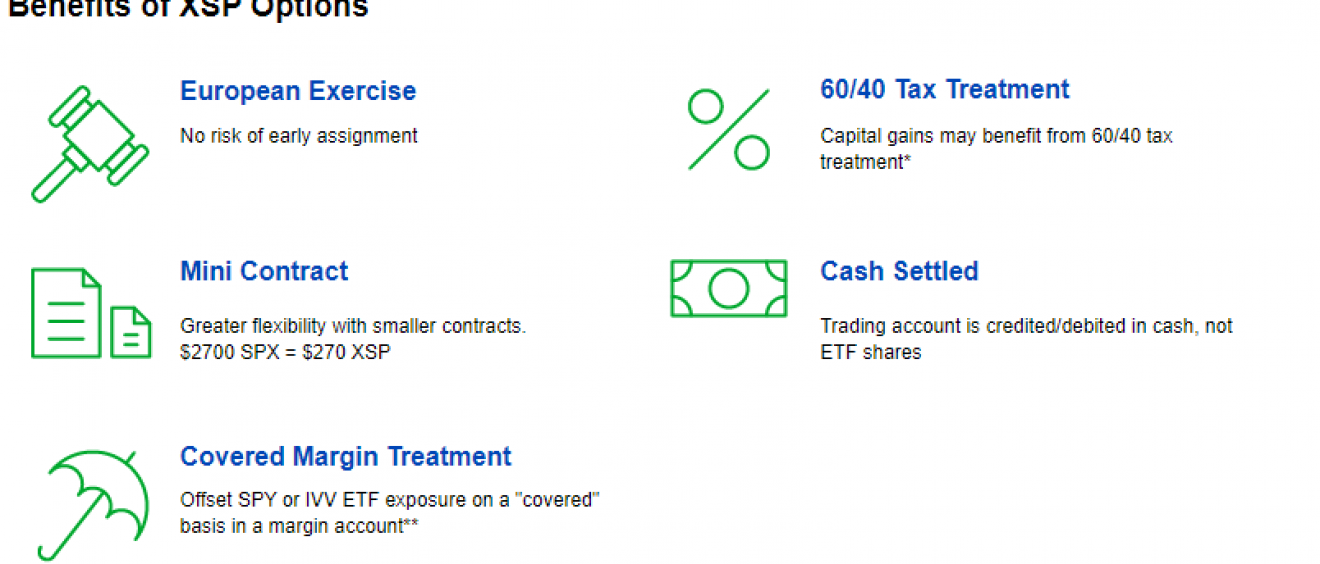
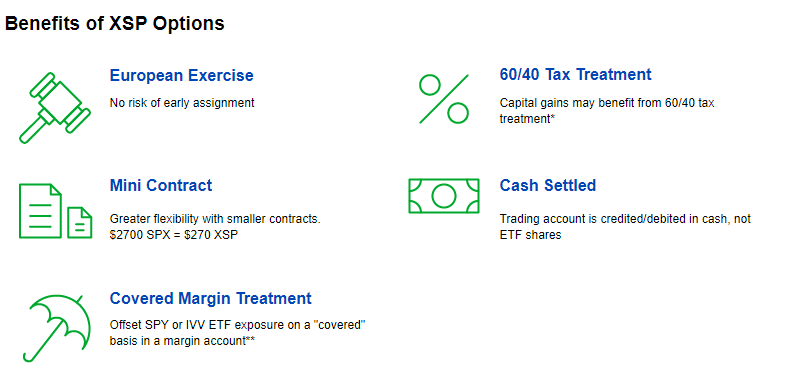
The Cboe Mini-SPX option contract, known by its symbol XSP, is an index option product designed to track the underlying S&P 500 Index. At 1/10 the size of the standard SPX options contract, XSP provides greater flexibility for new index options traders or traders managing an individual portfolio.

XSP Weekly Options

Whether it’s trading around specific events, such as earnings announcements or economic data reports, or executing overwriting or spread-trading strategies, Cboe XSP weekly options allow traders the granularity to more closely tailor their trades to meet their needs. And for traders executing premium collection strategies, XSP weekly options provide the opportunity to collect premium 52 times per year rather than 12.

XSP weekly options are offered with Monday, Wednesday, and Friday settlements. For Friday settlements, options contract expirations occur on non-standard Friday expirations throughout the year. Similarly, Monday and Wednesday XSP Weeklys options settlements may expire on any Monday or Wednesday of the month, other than a Monday or Wednesday that coincides with an end-of-month expiration date.

XSP Monday, Wednesday and Friday Weeklys options are typically listed on Friday, Tuesday and Thursday, respectively and will expire on their expiration date. If a standard or EOM options contract settlement exists in a week that coincides with a typical Weekly expiration date, a Weekly expiration will not exist on that expiration day. (The term Weeklys refers to the fact that the contracts are listed every week, not that they are a seven-day contract). Settlement processes for XSP weeklys are the same as their standard options counterparts (index, ETF, etc.).

Trading XSP

XSP options trade on Cboe’s Hybrid Trading System, which provides investors with the combined advantages of electronic trading and an open-outcry market on a single platform. XSP options also trade on the EDGX exchange.

XSP Options Product Specifications

Symbol: XSP

Underlying:
The Mini-SPX Index, based on 1/10th the value of the Standard & Poor’s 500 Index (SPX). The Standard & Poor’s 500 Index is a capitalization-weighted index of 500 stocks from a broad range of industries. The component stocks are weighted according to the total market value of their outstanding “free float” shares.

Multiplier:
$100.

Strike Price Intervals:
Generally, $1 or greater where the strike price is $200 or less and $5.00 or greater where the strike price is greater than $200. For XSP weekly contracts, the lowest strike price interval Cboe may list is $0.50.

Strike (Exercise) Prices:
In-, at- and out-of-the-money strike prices are initially listed. New strikes can be added as the index moves up or down.

Premium Quotation:
Stated in decimals. One point equals $100. The minimum tick for XSP options is 0.01 ($1.00) for all series, including LEAPS.

Exercise Style:
European – Mini-SPX Index options generally may be exercised only on the expiration date.

Last Trading Days:
The last trading day for Standard, Weekly and End-of-Month (EOM) XSP options is their expiration date. On their last trading day, trading in expiring XSP options closes at 4:00 p.m. ET.

Expiration Dates for Standard, Weekly and EOM Options:
Standard XSP options expire on the third Friday of the expiration month or the immediately preceding business day if the Exchange is not open on that Friday. XSP Weekly options expire on a Monday, Wednesday, or a Friday. If the Exchange is not open on a Wednesday or Friday, the normally expiring Wednesday or Friday Weekly will expire on the immediately preceding business day. If the Exchange is not open on a Monday, the normally expiring Monday XSP Weekly will expire on the first business day immediately following that Monday. EOM XSP options expire on the last business day of the expiration month.

Expiration Months:
Cboe may list up to six expiration months of XSP options at one time. Weekly options (End-of-Week, Wednesday Weekly), EOM options and LEAPS may also be listed.

Settlement of Option Exercise:
Exercise will result in delivery of cash on the business day following expiration. The exercise settlement value, XSP, is one-tenth (1/10th) the official closing price of the S&P 500 Index as reported by Standard & Poor’s on the last trading day of the expiring series. The exercise settlement amount is equal to the difference between the exercise-settlement value and the exercise price of the option, multiplied by $100.

Position Limit:
No position and exercise limits are in effect.

Margin:
Purchases of puts or calls with 9 months or less until expiration must be paid for in full. Writers of uncovered puts or calls must deposit / maintain 100% of the option proceeds* plus 15% of the aggregate contract value (current index level x $100) minus the amount by which the option is out-of-the-money, if any, subject to a minimum for calls of option proceeds* plus 10% of the aggregate contract value and a minimum for puts of option proceeds* plus 10% of the aggregate exercise price amount. (*For calculating maintenance margin, use option current market value instead of option proceeds.) Additional margin may be required pursuant to Exchange Rules 12.3(h) and 12.10.

CUSIP Number:
12505Q

XSP Trading Hours:
9:30 a.m. – 4:15 p.m. Eastern Time. On the last trading day, trading hours for expiring XSP standard, weekly and EOM options are 15 minutes shorter from 9:30 a.m. – 4:00 p.m. Eastern Time.

Vertical Spread – 0 DTE

Vertical Spread

Long Call Vertical Spread

A long call vertical spread is a bullish, defined risk strategy made up of a long and short call at different strikes in the same expiration.

Directional Assumption: Bullish

Setup:
– Buy ITM Call
– Sell OTM Call

Ideal Implied Volatility Environment: Low

Max Profit: Distance Between Call Strikes – Net Debit Paid

How to Calculate Breakeven(s): Long Call Strike + Net Debit Paid

Long Put Vertical Spread

A long put vertical spread is a bearish, defined risk strategy made up of a long and short put at different strikes in the same expiration.

Directional Assumption: Bearish

Setup:
– Buy ITM Put
– Sell OTM Put

Ideal Implied Volatility Environment: Low

Max Profit: Distance Between Put Strikes – Net Debit Paid

How to Calculate Breakeven(s): Long Put Strike – Debit Paid

Short Call Vertical Spread

A short call vertical spread is a bearish, defined risk strategy made up of a long and short call at different strikes in the same expiration.

Directional Assumption: Bearish

Setup:
– Sell OTM Call (closer to ATM)
– Buy OTM Call (further away from ATM)

Ideal Implied Volatility Environment: High

Max Profit: Credit received from opening trade

How to Calculate Breakeven(s): Short call strike + credit received

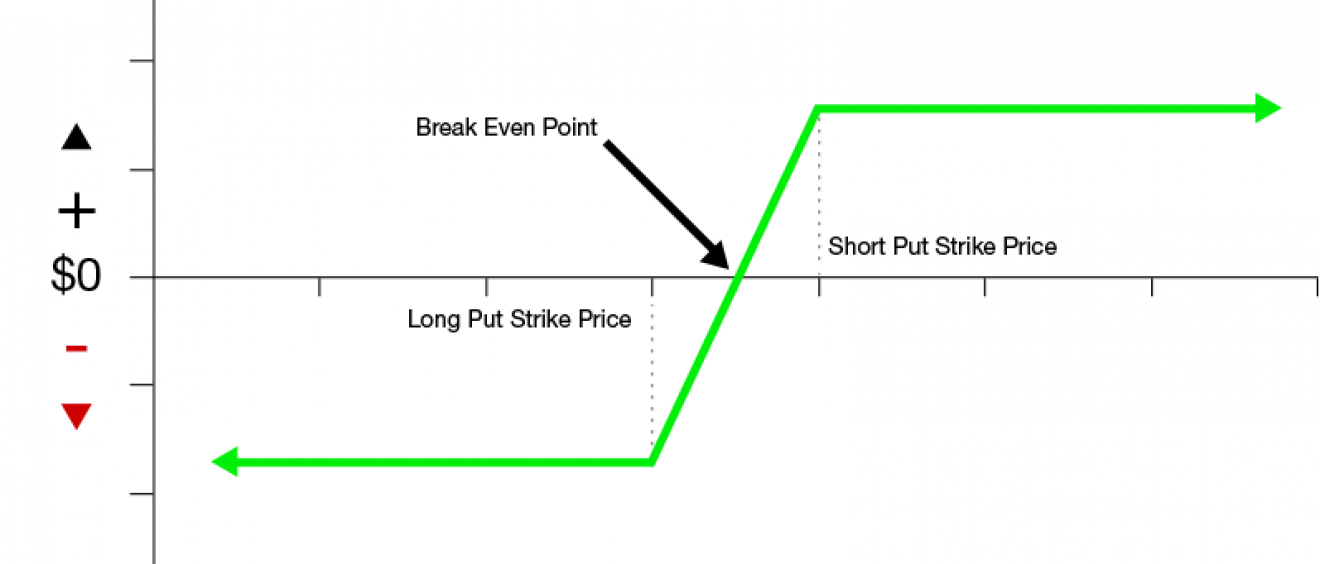
Short Put Vertical Spread

A short put vertical spread is a bullish, defined risk strategy made up of a long and short put at different strikes in the same expiration.

Directional Assumption: Bullish

Setup:
– Sell OTM Put (closer to ATM)
– Buy OTM Put (further away from ATM)

Ideal Implied Volatility Environment: High

Max Profit: Credit received from opening trade

How to Calculate Breakeven(s): Short Put Strike – Credit Received

Vertical spreads allow us to trade directionally while clearly defining our maximum profit and maximum loss on entry (known as defined risk).

While implied volatility (IV) plays more of a role with naked options, it still does affect vertical spreads. We prefer to sell premium in high IV environments, and buy premium in low IV environments. When IV is high, we look to sell vertical spreads hoping for an IV contraction. When IV rank is low, we look to buy vertical spreads to stay engaged and also use it as a potential hedge against our short volatility risk.

Since the maximum loss is known at order entry, losing positions are generally not defended. We always look to roll for a credit in general, and doing so with vertical spreads is usually difficult.

tips:
When do we close vertical spreads?
Profitable vertical spreads will be closed at a more favorable price than the entry price (goal: 50% of maximum profit)

When do we manage vertical spreads?
Losing long vertical spreads will not be managed but can be closed any time before expiration to avoid assignment/fees.

Iron Condor – 0 DTE

Iron Condor

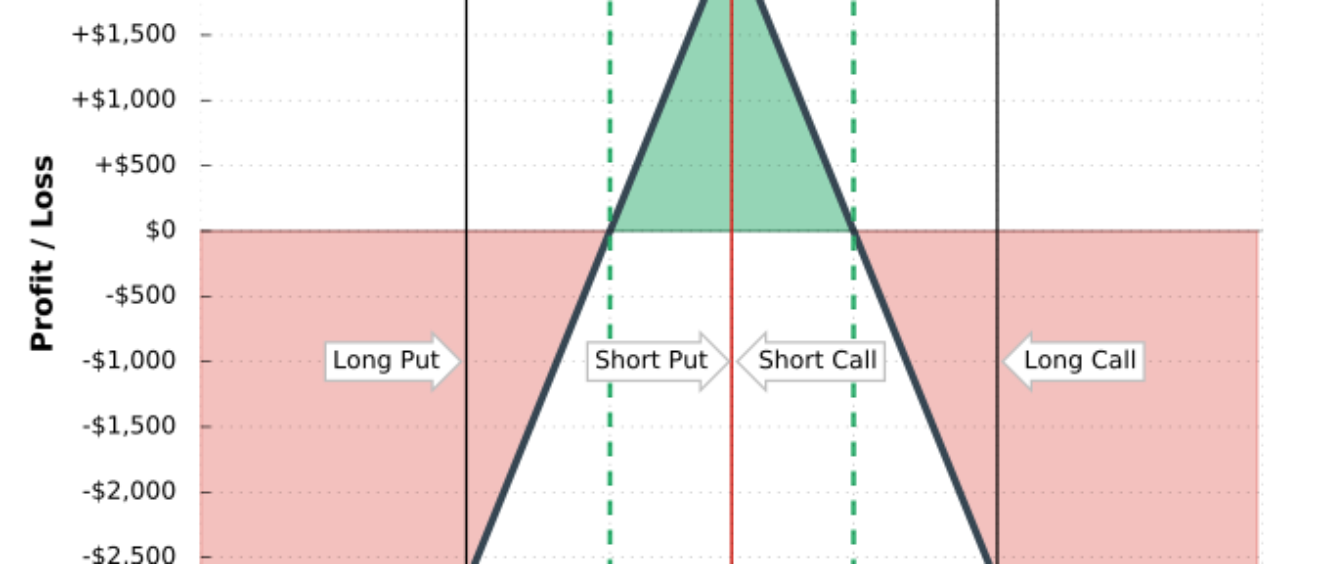
An Iron Condor is a directionally neutral, defined risk strategy that profits from a stock trading in a range through the expiration of the options. It benefits from the passage of time and any decreases in implied volatility.

Directional Assumption: Neutral

Setup:
– Sell OTM Call Vertical Spread
– Sell OTM Put Vertical Spread

Ideal Implied Volatility Environment : High

Max Profit: The maximum profit potential for an Iron Condor is the net credit received. Maximum profit is realized when the underlying settles between the short strikes of the trade at expiration.

How to Calculate Breakeven(s):
– Upside: Short Call Strike + Credit Received
– Downside: Short Put Strike – Credit Received

tips:
When do we close Iron Condors?
Much like other standard premium selling strategies, we close iron condors when we reach 50% of our max profit. This can increase our win rate over time, as we are taking risk off the table and locking in profits.

When do we manage Iron Condors?
We manage iron condors by adjusting the untested side, or profitable side of the spread. We look to roll the untested spread closer to the stock price to collect more premium. We can go as far as rolling our untested spread to the same short strike as our tested spread, which creates an iron fly.

SPX 0DTE strategy

What is SPX 0DTE strategy?

SPX weekly options that expire on every Monday, Wednesday and Friday we trade them on the day it expires. So, there is no overnight risk. Usually we open a credit spread when the market open around 9:30 A.M EST, and we close the trade before market close same day around 4:00 P.M EST. That is why it is called 0DTE, AKA same day option trade.

Why 0DTE strategy?

1. Can Profit if SPX increase, decrease, or doesn’t move at all. (High probability of making money)

2. Limited loss potential. Never worry about “blowing up” when the market makes a huge move (assuming appropriate position size)

3. Very simple strategy. The two primary credit spread strategies only have two components.

4. Consistent daily/weekly income. (why i started trading this strategy personally 🙂 )

What is SPX?

SPX, or the Standard & Poor’s 500 Index, is a stock index based on the 500 largest companies with shares listed for trading on the NYSE or NASDAQ. The term “largest” refers to each firm’s market capitalization or its stock price multiplied by the number of shares it has outstanding.

The SPX itself may not trade, but both futures contracts and options certainly do.

Why SPX?

1. SPX Options expire on every Monday, Wednesday and Friday.

2. SPX pays no Dividend.

3. SPX Cash Settled when the market closes at 4:00 P.M EST.

No risk of early assignment and loss of dividends, no portfolio disruption on assignment.

What is a Credit Spread?

A credit spread where we sell an option at one strike and simultaneously buy an option at another. The way we use this in the SPX Spread Trader is to use a 5 pt spread between the 2 strike prices. So if we are selling a 3100 call we are purchasing a 3105 call at the same time. By entering these two trades as a single credit spread order, there is only a single commission cost. The difference in prices between these two options provides a net credit to your account. The beauty of this approach, is that there is no price movement in the SPX required to be profitable. SPX can go flat or have little movement at all, and our trade will still be profitable. All we need is for the SPX to close below 3100 (in this example), and both options will expire worthless and we retain the credit.

SELL TO OPEN -1 SPX NOV 15 2019 3100 CALL

BUY TO OPEN +1 SPX NOV 15 2019 3105 CALL

Net credit of $0.60. max loss:$4.40

in this example, we are investing $500 to open a bear call spread, receiving $60, and risking $440. as long as SPX stays below 3100 at 4:00p.m. EST, we will keep $60.

Most of the time, we don’t wait till market close. We close the trade at 50-60% profit target, and 2-2.5X credit stop loss.

in this example, we would close it for $0.20. So, we would make 0.60-0.20=$0.40 profit. OR, we would stopped out at $1.50 which is at 1.50-0.60=$90 loss.

81%

Trade Win Ratio

* Around 20 delta

6%

Avg Returns / Trade

* $30 (profit) / $500 (investment)

50%

Profit Target

* 0.60 (credit received) x 0.5 = 0.30 (profit)

2x – 2.5x

STOP LOSS

* 0.60 credit received x 2.5 = 1.5 (stop loss) – 0.60 (credit received) = 0.90 (net loss 🙁 )